The Evolution of Data Visualisation
Data visualisation has evolved remarkably from ancient maps to the dynamic, interactive dashboards of today, paving the way for the integration of VR and AR data visualisation. Pioneers like Florence Nightingale leveraged graphical representations for storytelling, which now, in the era of big data, demand sophisticated tools for effective data interpretation.
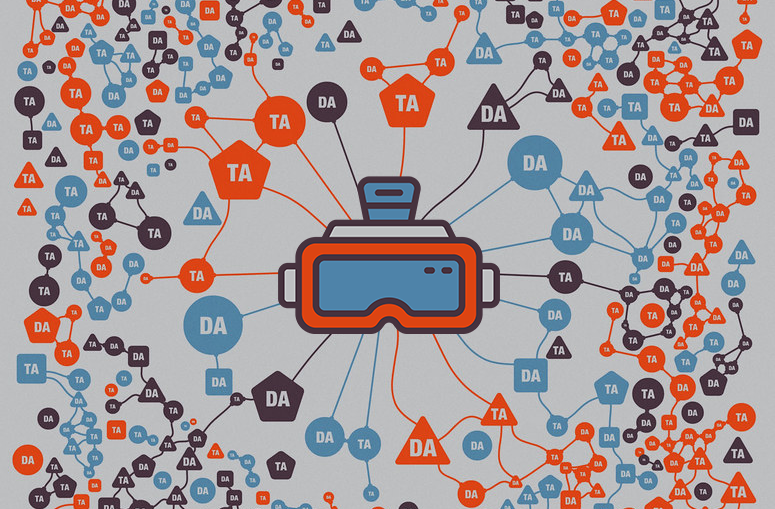
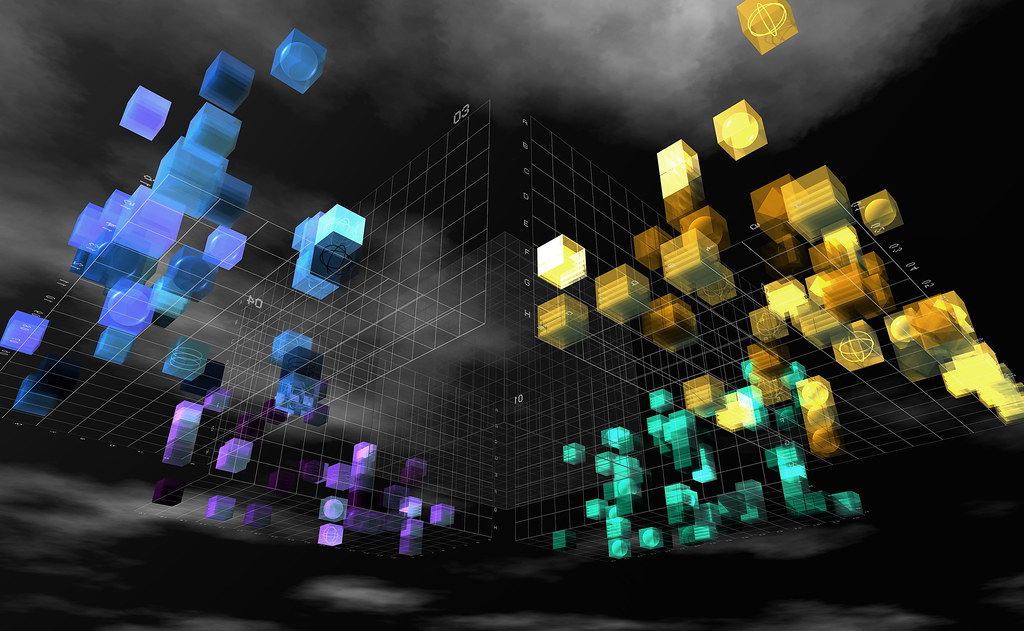
The latest leap in data visualisation comes with the incorporation of Virtual Reality (VR) and Augmented Reality (AR) technologies. VR immerses users in a controlled virtual space, transforming their interaction with data, while AR enhances the real world by overlaying digital information. This integration is revolutionising data visualisation, shifting from flat, two-dimensional analysis to interactive, three-dimensional experiences, reshaping our data analysis and interpretation methods.
Comparing Realms: Data Visualisation in AR vs. VR
Data visualisation can leverage the immersive depth of Virtual Reality and the contextual overlay of Augmented Reality to present complex information in transformative ways. VR engulfs users in a data-centric universe, ideal for deep analytics where full concentration is required, while AR anchors data to the real world, perfect for on-the-spot decision-making and collaborative discussions. As the technological boundaries between AR and VR begin to merge, innovative headsets from leaders like Meta and Apple are emerging that encompass both modalities. These hybrid devices promise a seamless transition between fully immersive and augmented experiences, broadening the scope for data visualisation applications that capitalise on the strengths of both worlds.
The Power of Immersive Data Visualisation
Immersive data visualisation is the practice of using VR and AR environments to interact with and understand data. Unlike traditional flat screens, these immersive environments allow users to step inside the dataset, offering a new dimension of interaction and comprehension.

Advantages of Immersive Data Visualisation:
Enhanced Understanding: Immersive environments enable users to experience data in 3D, making complex information more tangible and easier to understand.
Engaging Interaction: VR and AR create interactive experiences that actively involve users in the data exploration process, improving engagement and retention.
Contextual Awareness: AR, in particular, provides contextual data overlays that can significantly aid in situational understanding and decision-making.
Spatial Orientation: Data visualised in a three-dimensional space allows for a natural understanding of volume, density, and relationships between data points.
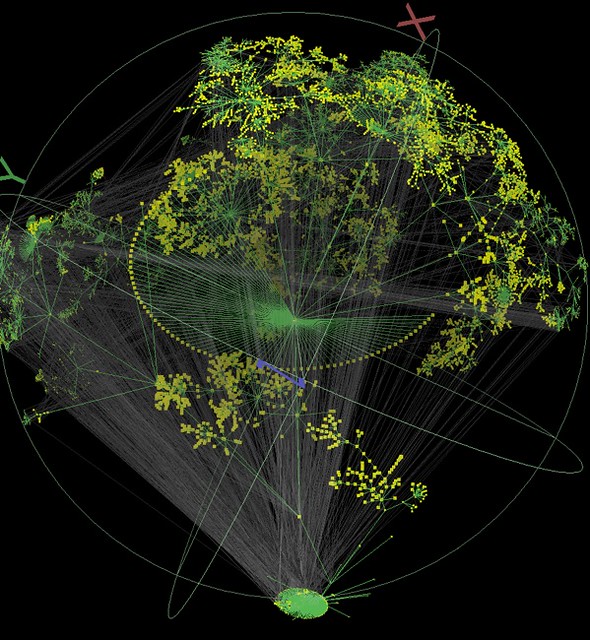
Scalability: Immersive visualisation can effectively represent large-scale data, offering users the ability to perceive and analyse vast amounts of information at once.
Collaborative Potential: AR and VR enable collaborative data analysis, allowing multiple users to view and discuss the same data in a shared virtual space.
These immersive technologies are setting the stage for a revolution in how we perceive and interact with data, offering an experience that is not just informative but also intuitive and engaging.
VR/AR Data Visualisation in Action
Within industries such as biotechnology, aerospace, and finance, VR/AR data visualisation is not just a concept but an active element of daily operations. For instance, in biotech laboratories, researchers use VR to simulate molecular interactions, offering a clearer understanding of complex biological processes. In aerospace, engineers employ AR for overlaying data onto physical models of aircraft for real-time analytics, aiding in design and testing.
Another noteworthy example is a financial analytics firm that adopted VR to visualise market trends and economic models, allowing analysts to identify patterns and correlations in a more intuitive and spatial manner.
Tools and Technologies for VR/AR Visualisation
The creation and rendering of VR/AR data visualisations are made possible by a combination of advanced software and robust hardware. Software platforms like Unity and Unreal Engine are frequently utilised for their powerful rendering capabilities and flexibility. For hardware, headsets such as the Oculus for VR and Microsoft HoloLens for AR are popular among professionals for their high fidelity and user-friendly interfaces.
The success of VR/AR visualisation tools also hinges on effective UI/UX design, ensuring that the user can navigate the data intuitively. The design must accommodate the unique demands of immersive environments, such as spatial navigation and three-dimensional data manipulation, which are critical for a seamless and productive user experience.

Challenges and Considerations
While VR/AR visualisation offers promising benefits, it’s not without challenges. High costs and technological intricacies often restrict access to entities with ample resources. Moreover, poorly executed VR/AR experiences can result in discomfort, such as motion sickness, and immersive environments may pose new risks for data security.
Mersus Technologies has proactively tackled these issues. Our applications on the Avatar Academy platform are designed with optimal performance in mind, ensuring a smooth and comfortable user experience without the risk of motion sickness. We employ stringent security protocols to safeguard our platform and client data.
Cost and production time remain significant hurdles in VR development. Mersus Technologies is innovating in this space with the forthcoming Avatar Academy editor function, enabling clients to create VR content efficiently through a user-friendly, low-code environment. This advancement promises to dramatically reduce the time and expense involved in crafting immersive experiences. As we continue to evolve, Avatar Academy will persist in offering versatile and insightful data visualisation tools to our clients, broadening the horizons of VR/AR potential.
The Future of Data Visualisation with VR/AR
Looking ahead, VR/AR data visualisation is poised to become more sophisticated with advancements in machine learning and AI, offering predictive analytics within immersive environments. As the technology becomes more accessible and affordable, it’s likely to become a staple in data analysis across various industries, potentially reshaping how decisions are made and offering unprecedented insights.
VR/AR visualisation stands as a significant leap forward in data analysis, offering immersive and intuitive insights. Its adoption can revolutionise decision-making processes, making complex data more comprehensible and actionable. As the technology matures and overcomes current limitations, its role in data analysis and presentation is set to expand, heralding a new era of informed decision-making.